I started on this project a long time ago, but just haven’t had time to finish it. We produced a publication for the Docking Institute of Public Affairs last fall on the results of their annual Kansas Speaks survey.

They prepared the text and the graphs. We designed the cover and did the pagination. But we also ended up doing a lot of tweaking on their charts and graphs. They created them in Excel. All the charts and graphs had to be converted to CMYK — easy enough to do in Illustrator. But we also had to make them more readable, which involved changing fonts and then also going back and putting white squares behind a lot of the numbers on the charts to make them more visible. It was easy enough, but kind of tedious, and we were doing it on a very tight deadline and with our usual amount of work. I’m pretty happy with what my co-worker and I were able to do.
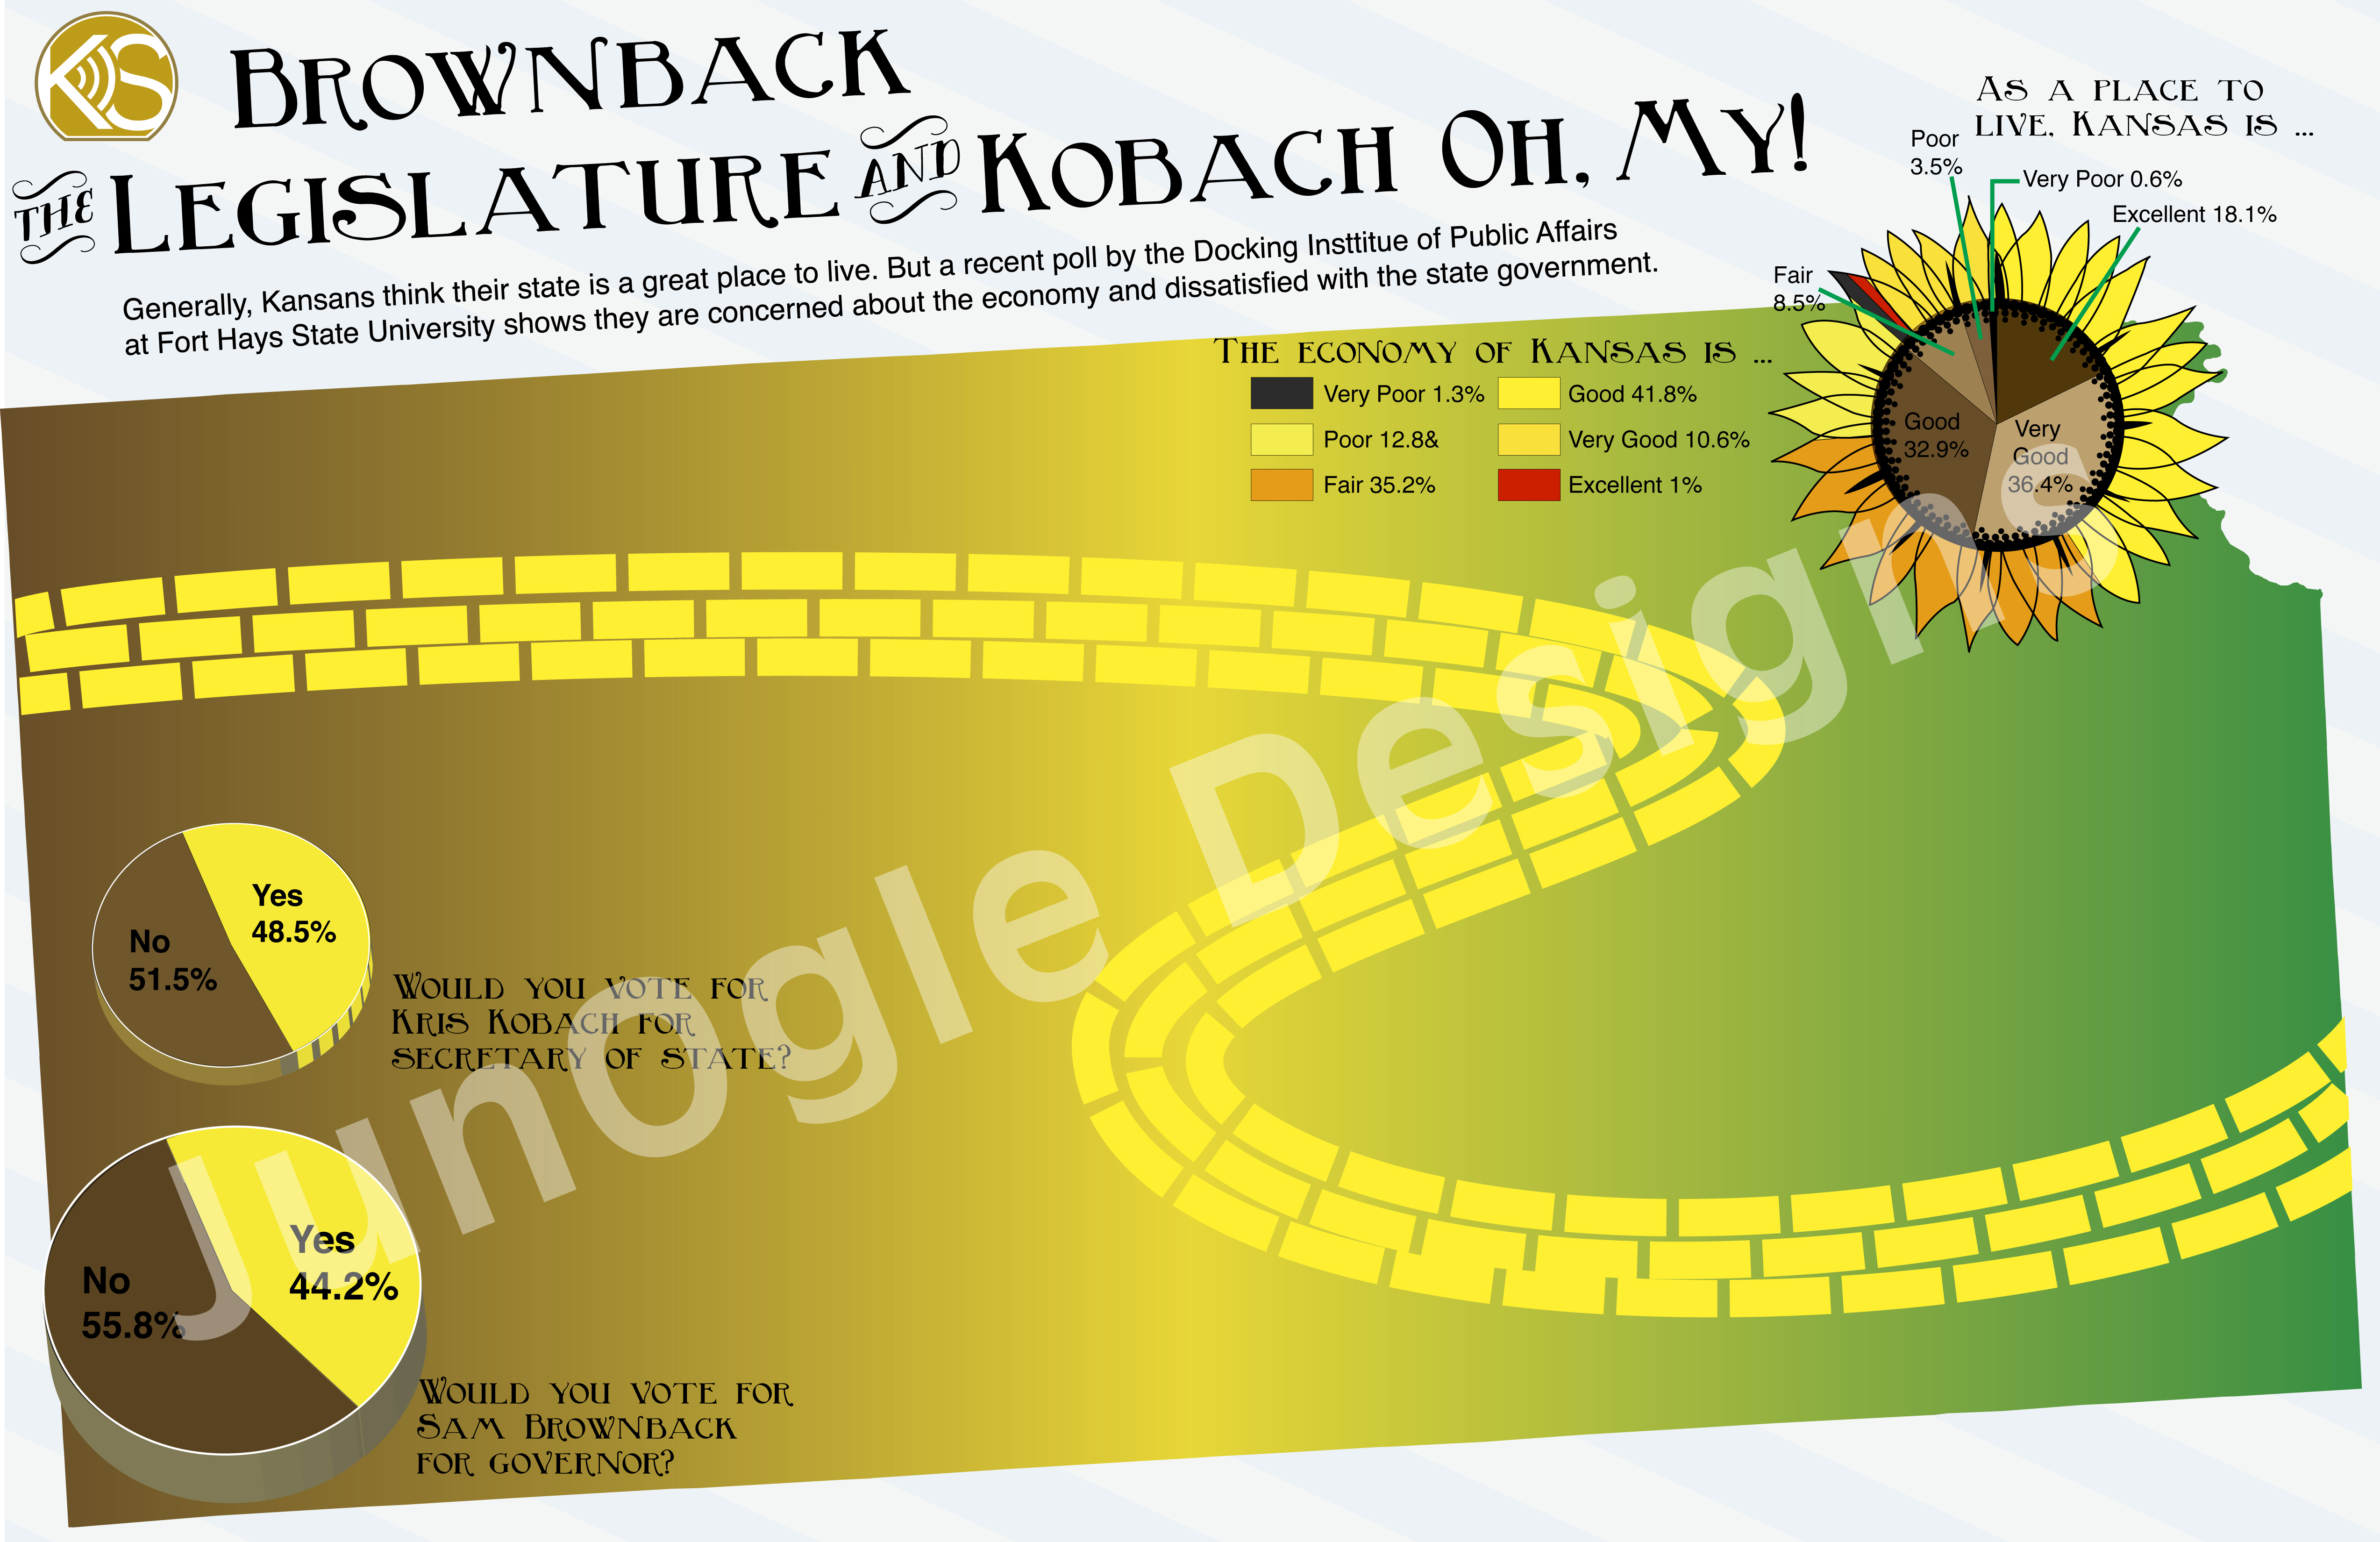
But after it was all said and done, I got to wondering what we could have done if we’d had more time and if we had been able to collaborate with the clients on creating the graphics.
This is what I came up with:
This was after about two weeks of working on it on my downtime, using the data they originally sent us. We’ve gotten much busier since then, so it’s unfinished. I hope to add more to it at some point to at least use as an example of what we are capable of doing.
I used their data from Excel to create the graphs in Illustrator, then enhanced them with some 3D effects or artwork. There are some bar graphs I’d somehow like to incorporate into the yellow brick road.
The charts they provided were fine for helping to show the results of their survey, but something like this is more likely to catch the reader’s eye and could also be prepared for sharing through social media.
And yes, I went there. I used a Wizard of Oz theme. I’m FROM Kansas, so I’m allowed. =)
